 Blog
Blog
Flow’s Engagement Thresholds Model
There are many models that illustrate different levels or modes of engagement, but at Flow we find it more useful to think about engagement as a series of thresholds that are passed through en route to a deeper impact. A lot of our work involves supporting our clients to enable and sustain transformative change for people, communities and organisations, through learning, participation and deeper involvement in arts, heritage, science or local citizenship. We have developed our Engagement Thresholds model to facilitate how this work is planned, delivered and evaluated. In its simplest form this can be visualised as a wedge-shaped graph, with number of participants on the y axis and depth of engagement on x.
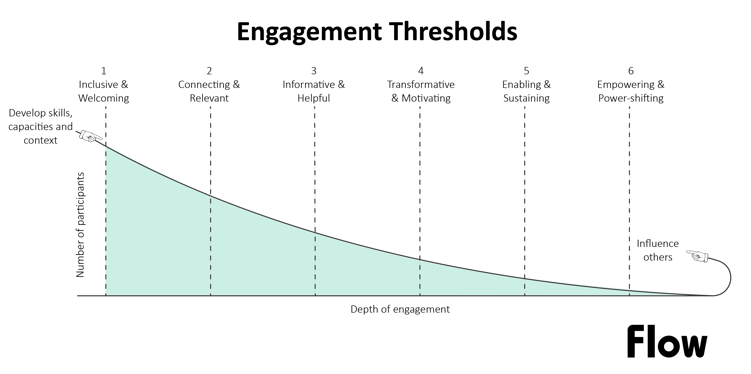
This model ensures we view engagement as more than boosting numbers or reaching certain groups of people. What matters most is the impact that this engagement has on the people involved, their lives and communities and the organisation itself. As people pass through each threshold they develop their skills, capacities and abilities to improve or cope with their context. While fewer people pass through each subsequent threshold those few are able to do so in a deeper way, until those at the narrowest end become the champions who will support and influence those behind them.
We are often asked to share the thinking behind our Engagement Thresholds model with clients who have found it helps them to design better experiences, assess the depth and reach of engagement, and identify barriers along the way. So here we have brought together a potted history of engagement and participation models, along with more detail on our own thinking.
What follows isn’t a definitive history, and we would love to hear from you if you can fill in any gaps.
The First Rung of the Ladder
Sherry Arnstein’s 1969 article A Ladder Of Citizen Participation has been referred to by many as a starting point for thinking about participation in terms of a series of levels. She wrote the article while she was director of community development studies for The Commons, a non-profit research institute. She had previously worked for the US department of health, education and welfare, and had been chief advisor on citizen participation for the US department of housing and urban development. She was frustrated by what she saw in these roles and wrote her article as a provocation, describing the various ways that people referred to a process of ‘citizen participation’.
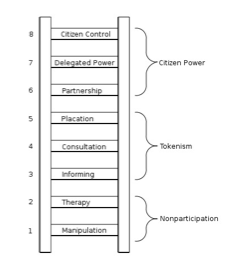
While the top 3 rungs of her ladder could be described as participatory, the others are more of a one-way process where people she describes as the ‘haves’ are in control of those described as ‘have-nots’. The middle three rungs are tokenistic at best, and the bottom three represent non participation.
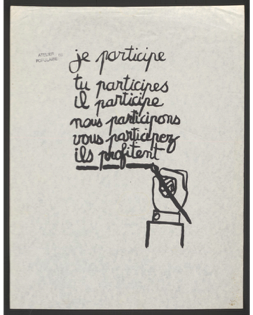
In the article she referred to a French student protest poster from 1968, a year which had seen worldwide unrest, to illustrate how damaging this pseudo-participation could be:
Reaching New Levels
Arnstein’s ladder of participation has become the basis of multiple models since, although many have taken her ideas literally as a hierarchy of goals rather than a question around the validity of these methods.
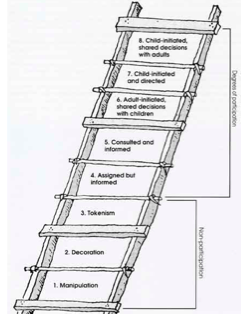
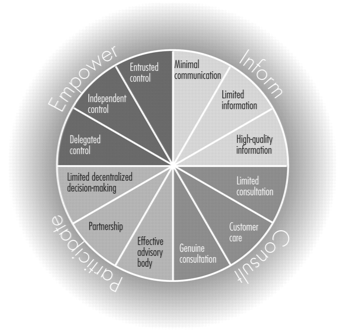
By the late 90s there were several useful iterations including Roger Hart’s 1997 ladder of youth participation which focused on a specific audience, and Scott Davidson’s 1998 wheel which highlights the ‘shades’ within each level, for example breaking ‘consultation’ down into three states: limited, customer care, and genuine consultation.
(These images were taken from nonformality’s timeline of participation models that starts with Sherry Arnstein and ends in 2011. If you are like me and enjoy looking at different diagrams and charts you should check it out )
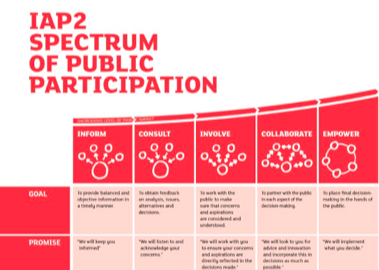
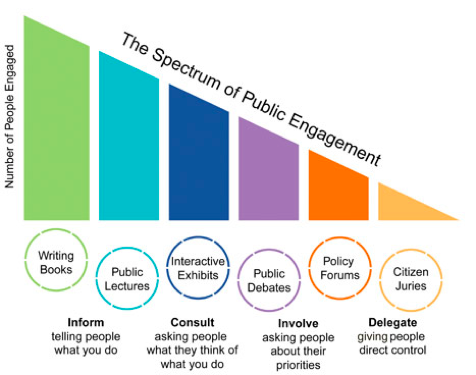
One of the best known and often referred to is the 1999 International Association for Public Participation’s ‘spectrum’ model, designed to identify levels of participation that define the public’s role in the process. Levels depend on the goals, time frames, resources, and depth of impact for the public.
While this is widely seen as a useful model, criticisms include the lack of reality in some of the categories. People have asked questions such as: Is ‘informing’ collaborative? Is ‘Empower’ possible? Where does ‘Listen’ fit in?
Public Engagement with Research
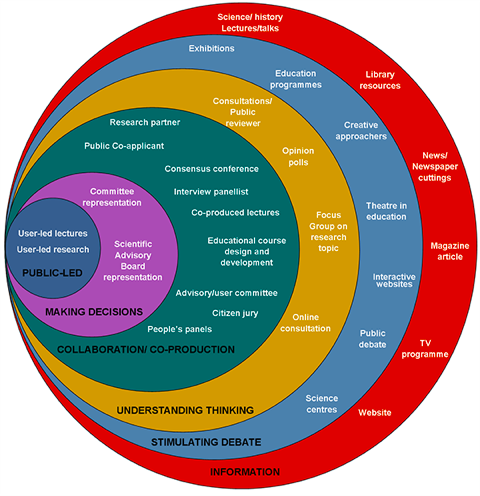
Many of the more recent participation models, such as the Wellcome Trust’s ‘Onion’, focus on public engagement with research (PER). This model shows how different activities can enable publics to influence research and policy to different extents, and is used by organisations such as Oxford University to inform their PER activity. The outer layer of the onion is made up of one-way interactions designed to share information, but as you peel away the layers the opportunities for dialogue grow until at the centre of the onion the power is transferred to the public.
Wellcome’s Onion inspired Edinburgh University’s Beltain Public Engagement network to develop their own model which goes one step further to consider the number of people involved at each level. Shaped like a wedge, this model helps to show the value at both ends of the scale. Lighter touch activities only designed to inform can have wider reach, while more intense projects with smaller groups can have a deeper impact.
Designing Better Experiences
Flow’s Engagement Thresholds model builds on all of these examples, but instead of defining different levels of engagement as goals to aspire to, we have drawn on our expertise in Experience Design to focus on the qualities of an experience, and how these enable people to pass through the thresholds necessary to reach new levels.
As an emerging field, the starting point of Experience Design is the changes you want to enable for people in terms of how they think, feel and act, so that your designs are based on impact rather than resource. The more detailed version of our model below sets out some of the indicators that people are passing through these thresholds.
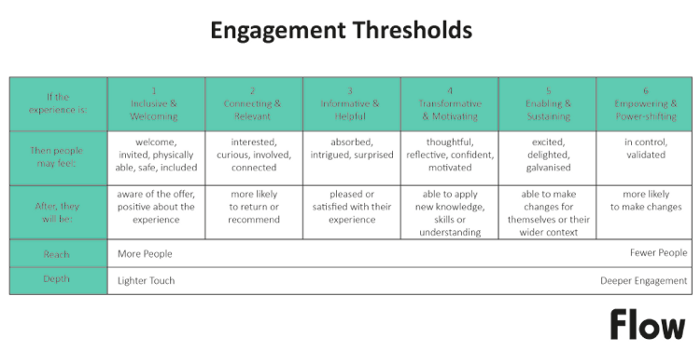
People may enter or exit the experience at different thresholds depending their personal context, and their experience of the event, activity or service you are offering. For example, thinking of participants in a workshop, people who arrive looking for information or help may leave feeling confident and motivated if they are given the tools to apply their new knowledge which in turn enables them to make changes for themselves. For others less confident about attending the same workshop then the welcome experience will be most important, and if it feels relevant to them they may leave feeling they have learned something useful.
‘Empowerment’ is also not the end goal, it is simply another threshold through which someone must pass in order to feel the deepest impact. This impact might come from a person being empowered to create changes in their life, through accessing your resources. Designing an experience that helps people to pass through these thresholds makes impact more likely because you are creating the conditions for change.
If you would like a high resolution PDF version of this model or arrange a call to talk through its uses please get in touch. We would love to hear your thoughts, and if you would like to use it please credit Flow Associates and link to our website.
By Susanne Buck